How to Debug a webapp on iOS WebView
The issue
A few months ago we suddenly faced a very strange problem. Our webapp looked completely broken in a very specific version on iOS inside a web view of another iOS app. Something was wrong with our Javascript code, but only on this particular context. First thing that came to our minds: “how are we going to debug this if we don’t even have access to our usual development tools?”
Our setup
We use AngularJS as the main framework for our project, and we basically use Chrome developer tools to debug any possible scenario.
The Solution
The answer to this problem is Safari and it’s Web Inspector (yes, you need a Mac for this). This way we have access to the javascript console.
To do that:
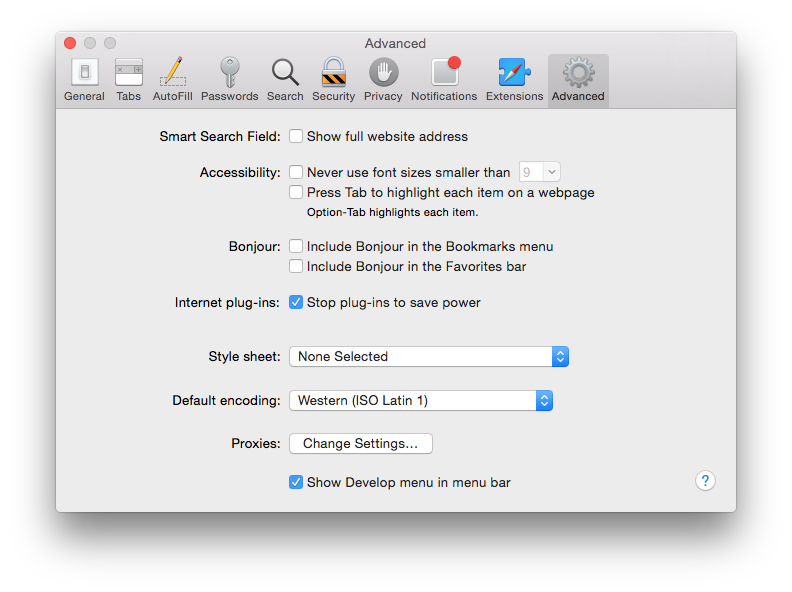
- Activate Developer menu: Go to Safari Preferences, and click on the Advanced tab. Check the last option: “Show Develop menu in menu bar”.

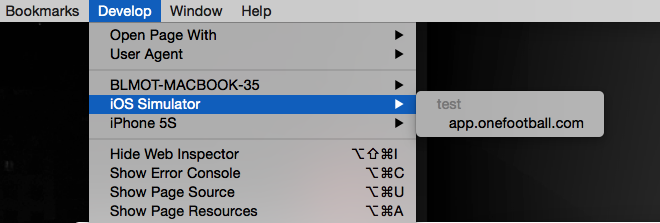
- Open the Error Console: Click on the new Develop menu option that just appeared and “Show Error Console”.

Once the Error console is accessible, we want to try it with a WebView. For that, we would create a basic iOS application that will load a WebView with the provided url. You can simply clone this repository: https://github.com/Onefootball/debugging-javascript-ios and double click the file with .xcodeproj extension.
The code:
#import "ViewController.h"

@interface ViewController ()  <UIWebViewDelegate, UITextFieldDelegate>
@property (weak, nonatomic) IBOutlet UIWebView *webView;
@end

@implementation ViewController

- (void)viewDidLoad {
    [super viewDidLoad];

    NSURL *url = [[NSURL alloc] initWithString:@"INSERT YOUR URL"];
    NSURLRequest *request = [[NSURLRequest alloc] initWithURL:url];

    [self.webView loadRequest:request];
}

@end
Note: If you add the code manually you will need to add UIWebView component to your storyboard and connect it to the controller. Docs
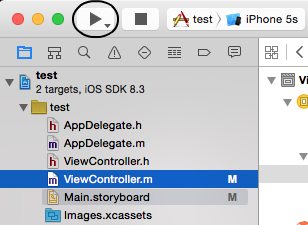
We compile and execute the app in the iOS Simulator, clicking on the “play” button of Xcode in the top left corner.
Now, we need to open Safari and open the Web Inspector for this iOS simulator. For that, click on Develop menu option in Safari and select iOS simulator and your webapp loaded on this webview (app.onefootball.com in this case). 
Fantastic! now we have access to a full console in Safari to debug our webapp. But there is one more problem: The error we were looking for is produced when the app is launched, and there is no way of accessing the console until the web view is loaded.
Solution: update our iOS application to support loading urls in execution time. The code:
#import "ViewController.h"

@interface ViewController ()  <UIWebViewDelegate, UITextFieldDelegate>

@property (weak, nonatomic) IBOutlet UIWebView *webView;
@property (weak, nonatomic) IBOutlet UITextField *textField;

@end

@implementation ViewController

- (void)viewDidLoad {
    [super viewDidLoad];

    NSURL *url = [[NSURL alloc] initWithString:@"INSERT YOUR URL"];
    NSURLRequest *request = [[NSURLRequest alloc] initWithURL:url];
    self.textField.delegate = self;


    [self.webView loadRequest:request];
}

- (BOOL)textFieldShouldReturn:(UITextField *)textField {
    NSURL *url = [[NSURL alloc] initWithString:textField.text];
    NSURLRequest *request = [[NSURLRequest alloc] initWithURL:url];

    [self.webView loadRequest:request];

    return YES;
}

@end
Note: we need to add an extra UITextField component to the storyboard.
This way we have a text field where we can insert the url we want to debug, and all the errors and logs will be shown on the safari console. 
Conclusion
Apparently the error was related to a bug with iOS 7.1.3 and AngularJS only for some devices(Iphone 5 and 5C) and the use of the Javascript Strict mode “use strict”. Source of the issue. We solve this problem by simply including a task available with this grunt plugin (grunt-remove-usestrict) that removes the existence of ‘use strict’ in your code.